BizTalk PaaS: Windows Azure BizTalk Services – Part IV
In the first post
on BizTalk Services I discussed setting up the service in Windows
Azure. One of the first steps in the setup was specifying the database
settings, access control and monitoring. In this post I like to discuss
the tracking and monitoring of BizTalk Services and deployed solutions.
The SQL database is setup for tracking purposes. This database is provisioned in Windows Azure. In the second tab you specify the database setting by providing a name, Server, and credentials.

In case you do not have a database server than you need to set that up, see How to Create and Configure SQL Database. In case you want to size the database, choose the edition and collation that you can check the configure advanced database settings option. An extra tab will be available for you to enabling you to specify these settings.

After having setup the BizTalk Services you can find the database under SQL Databases in the Windows Azure Portal.

You can select the database that has been created for the BizTalk Service, by clicking dashboard of the database and then click manage url.You will then be directed to Silverlight portal.
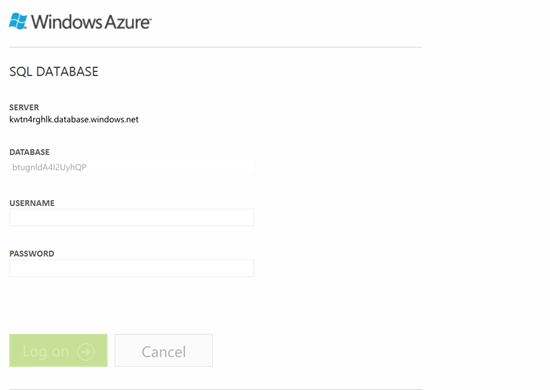
Provide credentials and you can access the database. Note that you may have to set firewall settings (rule) to be able to access the database. This can be done through dashboard selecting manage allowed ip addresses.

Once you have access to the database you can click design to see the tables, views and stored procedures of the database.


Tracking data is stored in tables and accessible directly or via views or stored procedures. By executing a select statement of the PipelineAndSourceTrackRecords view for instance I can see the tracked data of an XMLBridge I deployed in my BizTalk Service (see BizTalk PaaS: Windows Azure BizTalk Services – Part II).

The BizTalk Service itself can be monitored through the portal by selecting monitor.
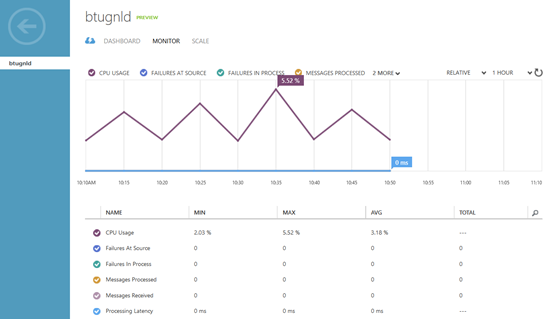
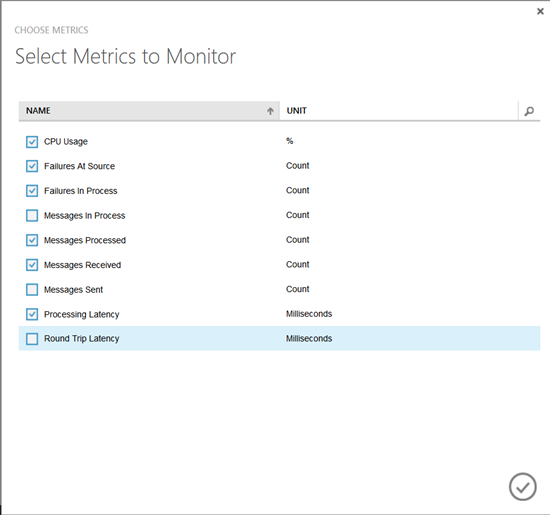
You can add metrics if you like to monitor more like message in progress or round trip latency.

Through the portal you can also depending on the chosen service tier (see previous post part III) scale the service.

To see the tracking data or monitor you might want to tap into the tracking database of the service.

You could connect to database and through views and tables see the tracking data. You might opt for creating a custom solution to visualize the tracking data like below.

Above you see a screenshot of windows form application that pulls the tracking data from SQL Azure database and fills two datagridviews. Data is gathered from the PipelineAndSourceTrackRecords View and TrackRecordRecordProperties table.
When I send a request message through a XMLBridge to a on-premise datasource (SQL Server).

A Tracking ID is sent for the message. This can be seen in tracking database. I created a new view based on the following query:
SELECT TrackId, RequestId, ServiceNamespace, EventType, EventSubType, EventLevel, EventTime, StageName, ActivityName, Name, Value FROM PipelineTrackRecords p INNER JOIN TrackRecordRecordProperties t ON p.Id = t.ParentId
Below you see adjusted monitoring form that leverages the data from the view into one datagrid.

The sent TrackId is present in the message going to the LOB source i.e. SQL Server database defined in WorkflowItinerary as runner_times.

A new TrackId is generated for the message returning to caller (client). This is pretty basic tracking that is being performed on backend i.e. SQL Azure database, when messages flow through the bridge. To make it more sophisticated you will need to do some custom coding to visualize and present the data to an end-user. In case you want extend the out-of-box tracking you will also have to custom code it yourself.
Cheers,
Steef-Jan
The SQL database is setup for tracking purposes. This database is provisioned in Windows Azure. In the second tab you specify the database setting by providing a name, Server, and credentials.

In case you do not have a database server than you need to set that up, see How to Create and Configure SQL Database. In case you want to size the database, choose the edition and collation that you can check the configure advanced database settings option. An extra tab will be available for you to enabling you to specify these settings.

After having setup the BizTalk Services you can find the database under SQL Databases in the Windows Azure Portal.

You can select the database that has been created for the BizTalk Service, by clicking dashboard of the database and then click manage url.You will then be directed to Silverlight portal.

Provide credentials and you can access the database. Note that you may have to set firewall settings (rule) to be able to access the database. This can be done through dashboard selecting manage allowed ip addresses.

Once you have access to the database you can click design to see the tables, views and stored procedures of the database.


Tracking data is stored in tables and accessible directly or via views or stored procedures. By executing a select statement of the PipelineAndSourceTrackRecords view for instance I can see the tracked data of an XMLBridge I deployed in my BizTalk Service (see BizTalk PaaS: Windows Azure BizTalk Services – Part II).

The BizTalk Service itself can be monitored through the portal by selecting monitor.

You can add metrics if you like to monitor more like message in progress or round trip latency.


Through the portal you can also depending on the chosen service tier (see previous post part III) scale the service.

To see the tracking data or monitor you might want to tap into the tracking database of the service.

You could connect to database and through views and tables see the tracking data. You might opt for creating a custom solution to visualize the tracking data like below.

Above you see a screenshot of windows form application that pulls the tracking data from SQL Azure database and fills two datagridviews. Data is gathered from the PipelineAndSourceTrackRecords View and TrackRecordRecordProperties table.
When I send a request message through a XMLBridge to a on-premise datasource (SQL Server).

A Tracking ID is sent for the message. This can be seen in tracking database. I created a new view based on the following query:
SELECT TrackId, RequestId, ServiceNamespace, EventType, EventSubType, EventLevel, EventTime, StageName, ActivityName, Name, Value FROM PipelineTrackRecords p INNER JOIN TrackRecordRecordProperties t ON p.Id = t.ParentId
Below you see adjusted monitoring form that leverages the data from the view into one datagrid.

The sent TrackId is present in the message going to the LOB source i.e. SQL Server database defined in WorkflowItinerary as runner_times.

A new TrackId is generated for the message returning to caller (client). This is pretty basic tracking that is being performed on backend i.e. SQL Azure database, when messages flow through the bridge. To make it more sophisticated you will need to do some custom coding to visualize and present the data to an end-user. In case you want extend the out-of-box tracking you will also have to custom code it yourself.
Cheers,
Steef-Jan


Comments