BizTalk CAT Instrumentation Framework Controller: My First Experience
In past I have used log4net or System.Diagnostics.Trace component of .NET for logging and tracing. Until a few months ago the post Best Practices for Instrumenting High Performance BizTalk Solutions got my attention. I read it, but did not start using it directly as I wasn’t doing any development. These days I sometimes am involved in development of BizTalk solutions, so moment was there.
Recently BizTalk CAT Instrumentation Framework Controller was released on CodePlex. The BizTalk CAT Instrumentation Framework is a high performance tracing/logging framework for BizTalk that builds upon the Event Tracing for Windows (ETW) infrastructure. It was created by Microsoft's BizTalk Customer Advisory Team (CAT). The Controller is an easy-to-use GUI for the BizTalk CAT Instrumentation Framework.
My thinking was why don’t I try this UI out in combination with Microsoft AppFabric CAT Best Practices Samples. The BizTalk Instrumentation Best Practices Samples solution provides a reusable framework intended to help BizTalk developers enrich their solutions with high-performance instrumentation based on the Event Tracing for Windows (ETW) infrastructure. I downloaded the BizTalk Car Instrumentation Framework Controller and installed it on one of my development sandboxes (Hyper-V, see this post). Before you can use it to trace what is happing for instance in an orchestration you will need to download Microsoft AppFabric CAT Best Practices Samples (containing solution Instrumentation Framework V1.4), open the solution, sign with strong name and build it. Next step is to reference the framework inside project containing your orchestration. I use my SalesForce Implementation (see this blog part I and part II) as an example in this post to show how I set things up.
Inside my orchestration I followed procedure as described in post Best Practices for Instrumenting High Performance BizTalk Solutions (see section Instrumentation for Orchestrations). A well instrumented orchestration has an entry point after receive shape:
The internal state of orchestrations (e.g. variables, results from method calls, non-sensitive message payload) is wisely traced (using TraceInfo). I used this twice in my orchestration consuming the SalesForce service i.e. request message and response message.
The exit point from an orchestration is recorded (using TraceOut) either right before the Terminate shape or at the very last step in the orchestration:
I did not include any error handling in this orchestration; otherwise unexpected behavior can be reported as soon as it is detected using TraceWarning or TraceError. The detailed information about a runtime exception is traced from inside the exception handling block using TraceError. If scopes are used the duration of individual scopes or/and entire orchestration can be measured and traced using TraceStartScope and TraceEndScope.
I deployed my instrumented orchestration and added the Microsoft.BizTalk.CAT. BestPractices.Framework to resources of my BizTalk application. I started the application together with GUI for the BizTalk CAT Instrumentation Framework and DebugView.
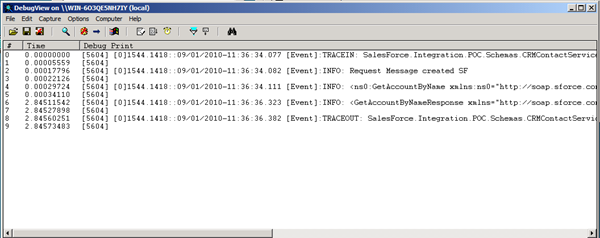
I started the trace (Start Trace) and placing a test message in a folder for BizTalk to picked up. I instantly saw trace information being displayed in DebugView.
In this post I shared my first experience with using BizTalk CAT Instrumentation Framework Controller. What I have described here it pretty basic and shows how easy tracing can be setup (see also “BizTalk Application Tracing Made Easy with BizTalk CAT Instrumentation Framework Controller” by Valery Mizonov ). Compared to using log4net this experience was more compelling and has its advantages in better agility and performance . If you want to make extensive use of BizTalk CAT Instrumentation Framework Controller I suggest to read the post “Best Practices for Instrumenting High Performance BizTalk Solutions” (Valery Mizonov) and related links you find there. In latest Hotrod issue you will find article Instrumentation Best Practices for High Performance BizTalk Solutions (page 47).
Technorati:


Comments
i downloaded "BizTalk Instrumentation Best Practices Samples solution" but when i open it, it gives me an error (failing to connect to some TFS server)
after that it opens offline and when i compile it, it gives me an error.
my issue is i need the assembly "Microsoft.BizTalk.CAT.BestPractices.Framework.dll" with strong name
can you tell me how to get it
Thanks in Advance
Ash
Any advice would be much appreciated.
Thank you
Kishore
"using Microsoft.BizTalk.Message.Interop;"
is missing an assembly or reference. Do I need to add any assembly reference.
Any advice would be much appreciated.
Many thanks
Kishore
I am just getting started with the CAT Instrumentation Framework and the various ETW tools.
Have you considered writing an update to this topic? What has your experience with this framework been like since you wrote this article?
I'm finding it easy to instrument my BizTalk application but frustrating to get anything but the most superficial information from the traces. What assembly/application did that TraceInfo come from? No clue. How do I consolidate traces from all the servers in a BizTalk group? No idea.
Any insight you can give would be appreciated.
I will write an update soon and hope to provide some more insight.
For a perticular assembly or a perticular orchestration can trace through this CAT frameWork
Another concern I have is how to overcome the issue that you are not able to see the contents of the log file unless you stop the trace. In a production environment you need to have the trace running forever, hence how are you supposed to read the contents of the file without stopping the trace?